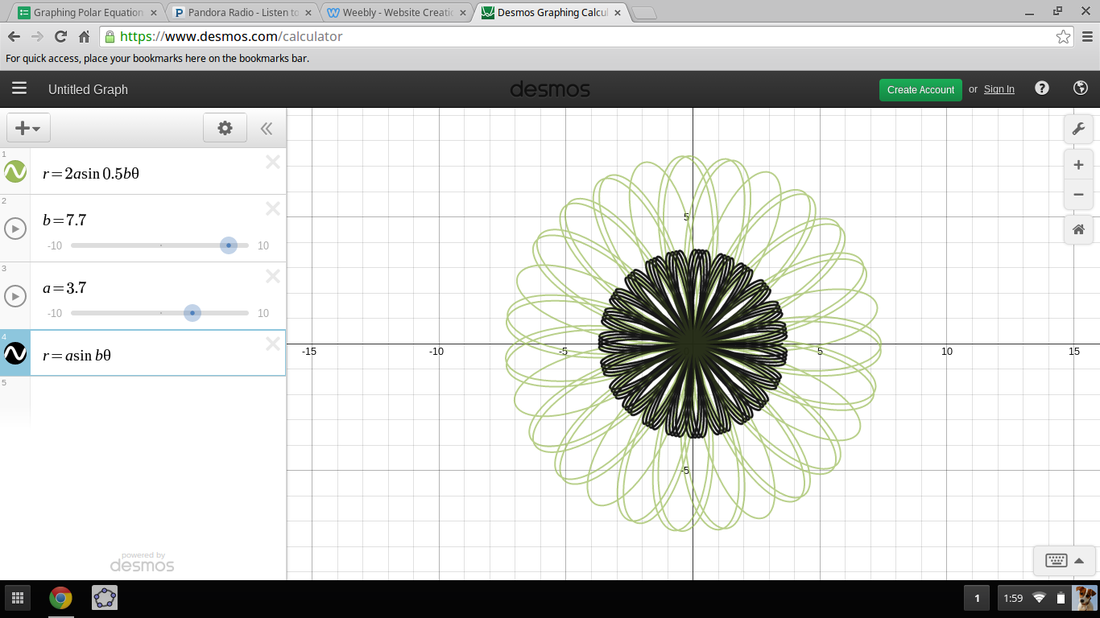
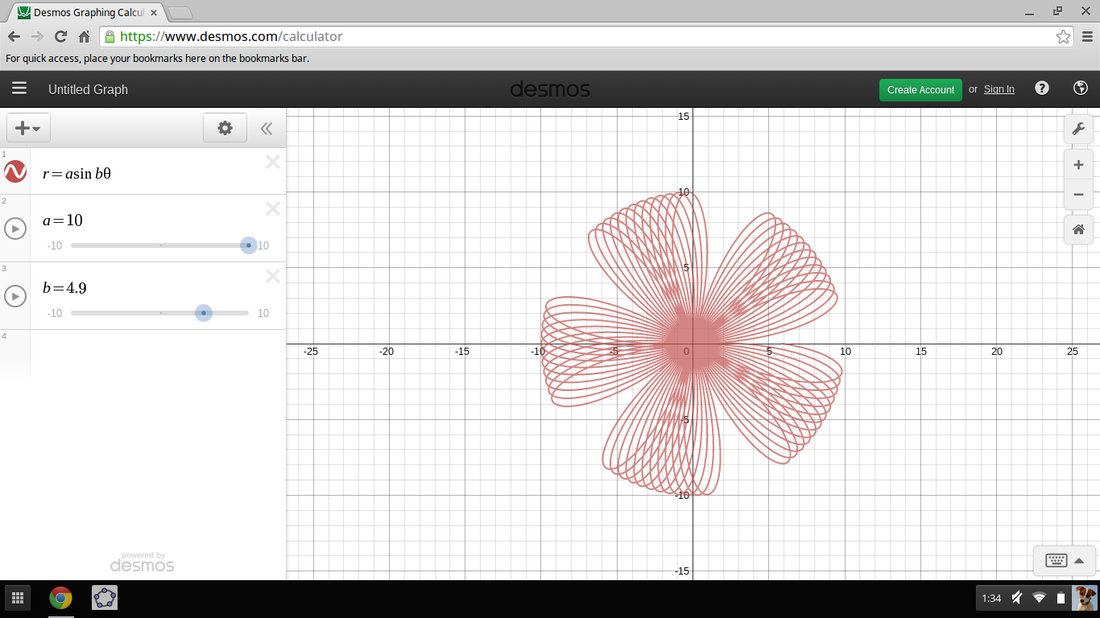
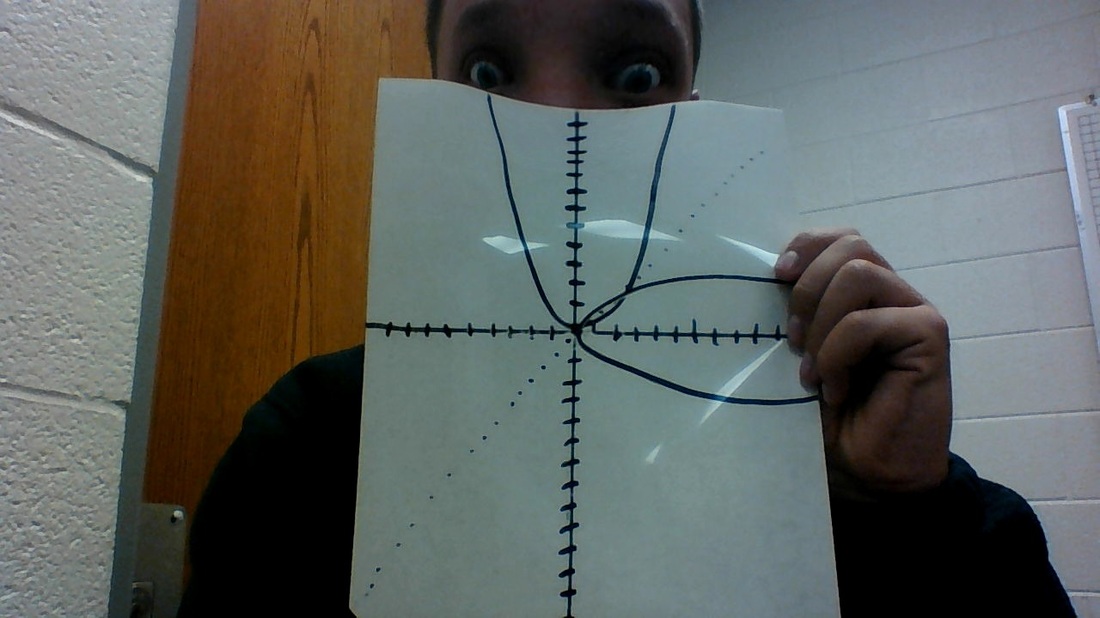
This project was surprisingly very fun to do! I thought it was really interesting that the different coefficients moved the graph around. My favorite was the butt graph we did but I didn't manage to get a picture, but it was a lot of fun to create. Pictured above from left to right, is the original "Spiral of Archimedes" which is r=theta. The middle picture is an adapted "Spiral of Archimedes", the equation is r=0.5theta. The last picture is a rose that I graphed, the equation is r=asinbtheta.
https://drive.google.com/a/slsharks.net/?utm_source=en&utm_medium=button&utm_campaign=web&utm_content=gotodrive&usp=gtd<mpl=drive&pli=1#shared-with-me
float sinVal;
int toneVal;
int k=0;
void setup () {
pinMode(8,OUTPUT);
}
void loop () {
while (k< 2000){
for (int x=0;x<180;x++) {
// convert degrees to radians then obtain sin value
sinVal = (sin(x*(3.1412/180)));
// generate a frequency from the sin value
toneVal = 2000+(int(sinVal*1000));
tone(8, toneVal);
k++;
delay(2);
}}
for (int x=0;x<180;x++) {
// convert degrees to radians then obtain sin value
sinVal = (sin(x*(3.1412/180)));
// generate a frequency from the sin value
toneVal = 2000+(int(sinVal*1000));
tone(8, toneVal);
delay(5);}
}
We changed the frequency, amplitude, and delay to make the siren sound different every 5 seconds.0 Comments
Using a unit circle is a very easy skill to master. As long as you know sine, cosine, and tangent it will be as simple as pie. For example, if you are looking for the sine, cosine, and tangent of 30, first, to find the sine of 30, look at the y coordinate above the sine of 30. Next, for the cosine of 30, look at the x coordinate of the numbers above 30. The trickiest part, by far, is tangent. So, to find the tangent of 30, take the sine and divide it by the cosine, and that will get you the tangent.

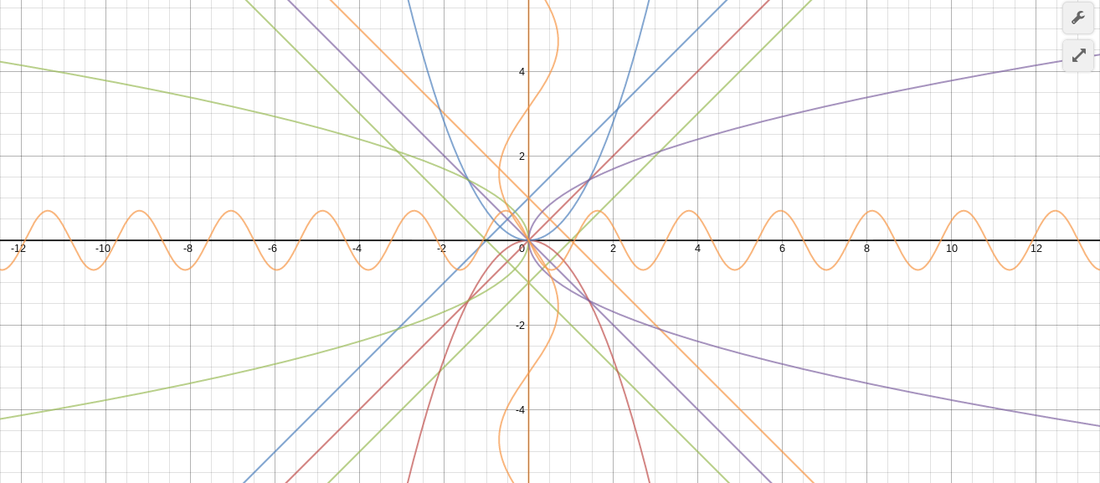
For my art project I used multiple types of equations to attempt to make the most interesting piece of art possible. From simple equations like x=2 to more complicated equations such as aSin(bx). When I first started this project I didn't think that it was possible to make such cool art with families of functions. Overall I thought this was a very useful project to help explore the the possibilities of functions.
Skateboard-ramp experiment
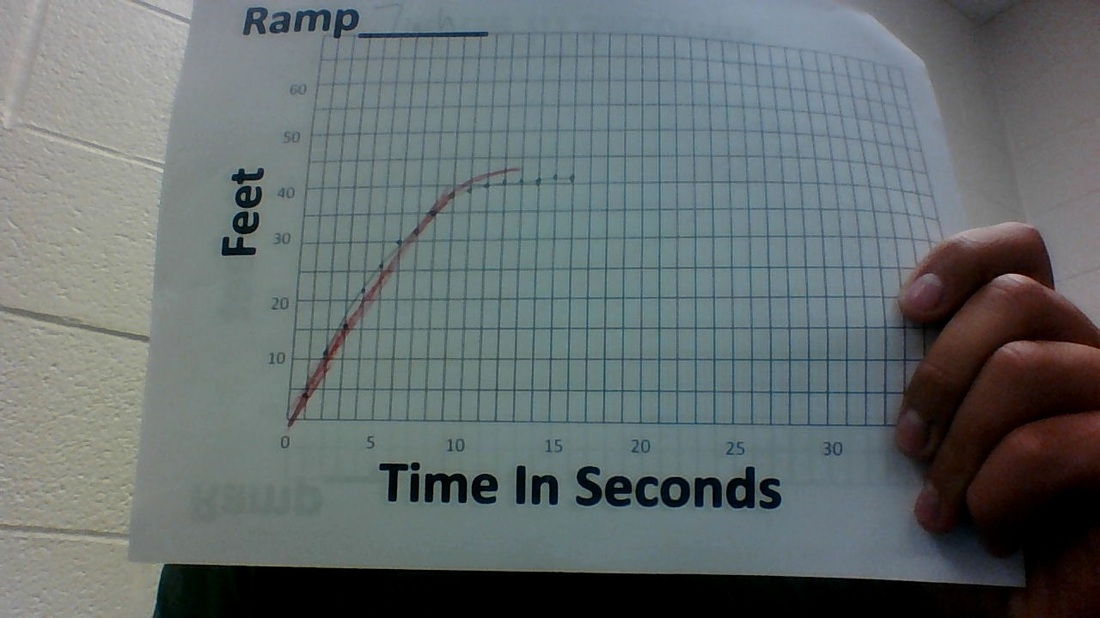
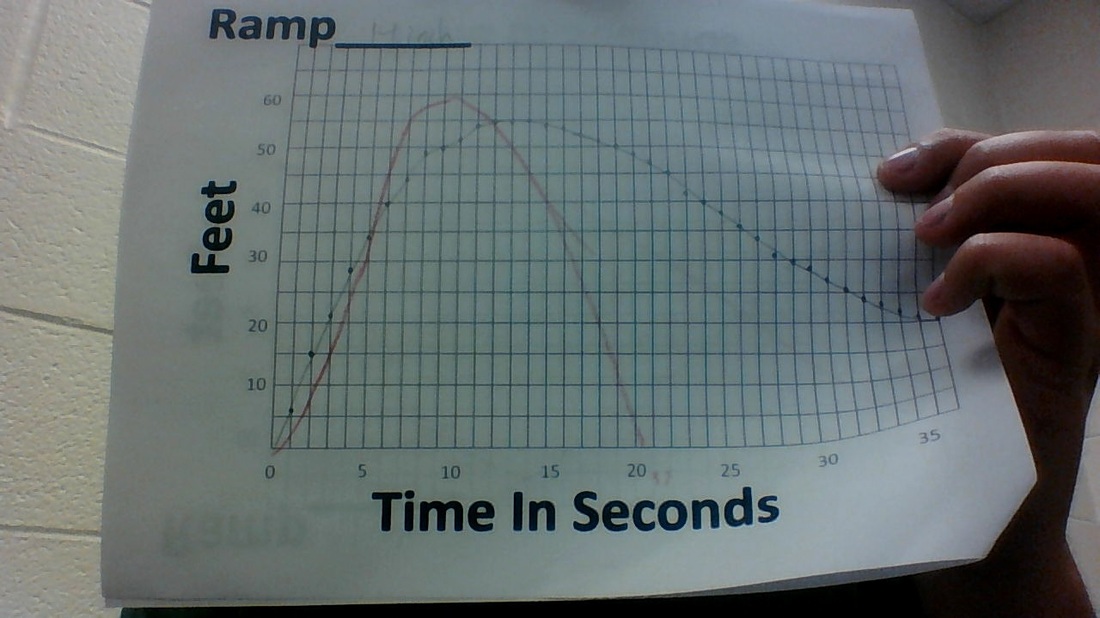
A. My predictions were not even close on the first one, but they got better as I did more. They were different because I did not take note on where the skateboard was the first time. The initial graph was honestly just a guess because I had no clue where to even start.
B. The zeros on my graph represent the starting point of the skateboard and where the "origin" is located. The domain of all the graphs are Time in seconds and the Range is Feet.
C. In terms of zeros, they all start at zero, but differ after the first second. The Maximums and minimums were completely different because they are different size ramps. The maximums are similar because thats the spot where the skateboard stops motion and rolls back down the driveway.
D. When the graph is rising the fastest the skateboard has reached its fastest speed and when the graph goes down the fastest the skateboard has reached the same point, but its going back down hill.
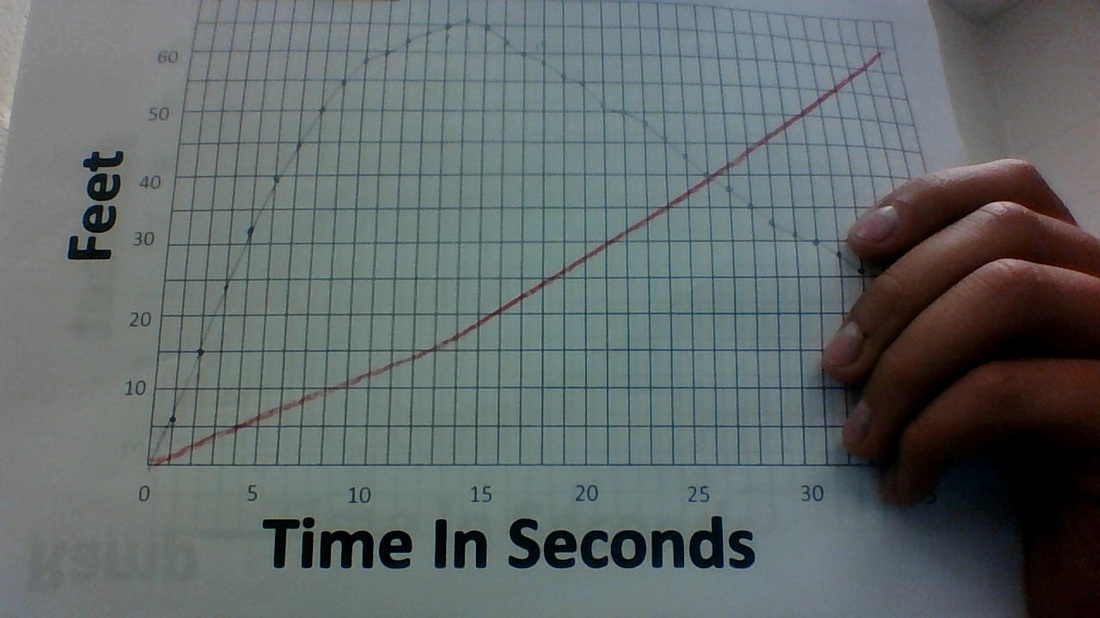
E. Basically, a ramp was set up at the end of a driveway (64 Feet Long), and a skateboard was launched off a 21,14, and 7 inch ramp. The skateboard went down the driveway and stopped then rolled back down the driveway. It was timed and we had to make graphs on the relationship between feet and seconds.
B. The zeros on my graph represent the starting point of the skateboard and where the "origin" is located. The domain of all the graphs are Time in seconds and the Range is Feet.
C. In terms of zeros, they all start at zero, but differ after the first second. The Maximums and minimums were completely different because they are different size ramps. The maximums are similar because thats the spot where the skateboard stops motion and rolls back down the driveway.
D. When the graph is rising the fastest the skateboard has reached its fastest speed and when the graph goes down the fastest the skateboard has reached the same point, but its going back down hill.
E. Basically, a ramp was set up at the end of a driveway (64 Feet Long), and a skateboard was launched off a 21,14, and 7 inch ramp. The skateboard went down the driveway and stopped then rolled back down the driveway. It was timed and we had to make graphs on the relationship between feet and seconds.
Inverse Functions Blog
The inverse of y=x^2 was found by switching x and y. Therefore the inverse is the square root of x. Yes because the horizontal line test proves that you can have inverses that are also functions. I was actually shocked when I i folded the paper and the lines matched up! Overall the activity was fun and provided much needed information for my knowledge.
The inverse of y=x^2 was found by switching x and y. Therefore the inverse is the square root of x. Yes because the horizontal line test proves that you can have inverses that are also functions. I was actually shocked when I i folded the paper and the lines matched up! Overall the activity was fun and provided much needed information for my knowledge.
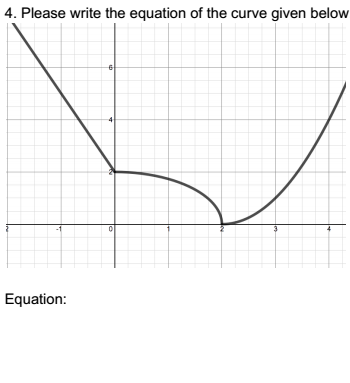
Piecewise Functions
For this equation, we had the function y=-2x+2 if x < 0 and turned it into y=(x-2)^2 if x > 2. To change the function, we made the first, original equation into y=sqrt 4-x^2 if 0 < x < 2. Then changed that into the final equation, y=(x-2)^2 if x > 2.
For this equation, we had the function y=-2x+2 if x < 0 and turned it into y=(x-2)^2 if x > 2. To change the function, we made the first, original equation into y=sqrt 4-x^2 if 0 < x < 2. Then changed that into the final equation, y=(x-2)^2 if x > 2.
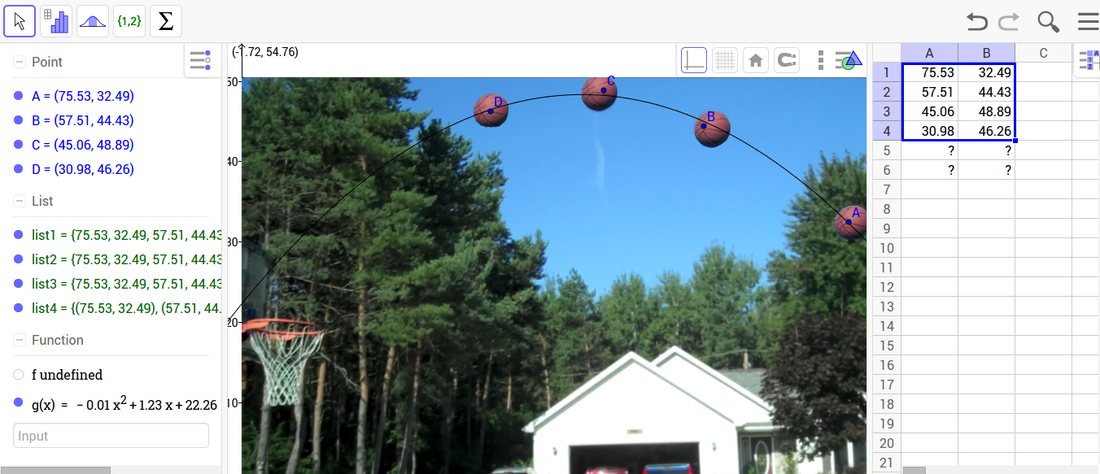
Basketball Function
After using GeoGebra to do this project, I predict that the ball will go in the hoop due to the line hitting the backboard inside the square. Therefore the ball will bounce off and go through the hoop.
After using GeoGebra to do this project, I predict that the ball will go in the hoop due to the line hitting the backboard inside the square. Therefore the ball will bounce off and go through the hoop.
Connecting Zeros and Factors
In this worksheet, we did problems on finding zeros by factoring, graphing, long division, and synthetic dividing. The connection between zeros and factors is that they are opposites. With factors you can find the zeros and with zeros you can find the factors. Division helps us use to factor polynomials because we use the quadratic formula to find the zeros we need. If we have three variables long division and synthetic division will help us find those. The degree of the polynomial helps us find the number of zeros in the formula. For example, if you had something like x^4-4x^3+8x^2-16x+32 you can tell that we will be looking for 4 zeros. This will always tell us how many zeros we will have, even if you have repeating numbers. It will never change.
In this worksheet, we did problems on finding zeros by factoring, graphing, long division, and synthetic dividing. The connection between zeros and factors is that they are opposites. With factors you can find the zeros and with zeros you can find the factors. Division helps us use to factor polynomials because we use the quadratic formula to find the zeros we need. If we have three variables long division and synthetic division will help us find those. The degree of the polynomial helps us find the number of zeros in the formula. For example, if you had something like x^4-4x^3+8x^2-16x+32 you can tell that we will be looking for 4 zeros. This will always tell us how many zeros we will have, even if you have repeating numbers. It will never change.
Limits
A limit is a point on a graph that we look at from the left and the right and we see the numbers approaching the point on the graph we looked at. We can tell if a limit exists by looking at the point and seeing if the left hand numbers and the right hand numbers approach the same number. Limits help us explain function behavior at points of discontinuity by showing what happens at the right side and the left side at the point of discontinuity.
A limit is a point on a graph that we look at from the left and the right and we see the numbers approaching the point on the graph we looked at. We can tell if a limit exists by looking at the point and seeing if the left hand numbers and the right hand numbers approach the same number. Limits help us explain function behavior at points of discontinuity by showing what happens at the right side and the left side at the point of discontinuity.
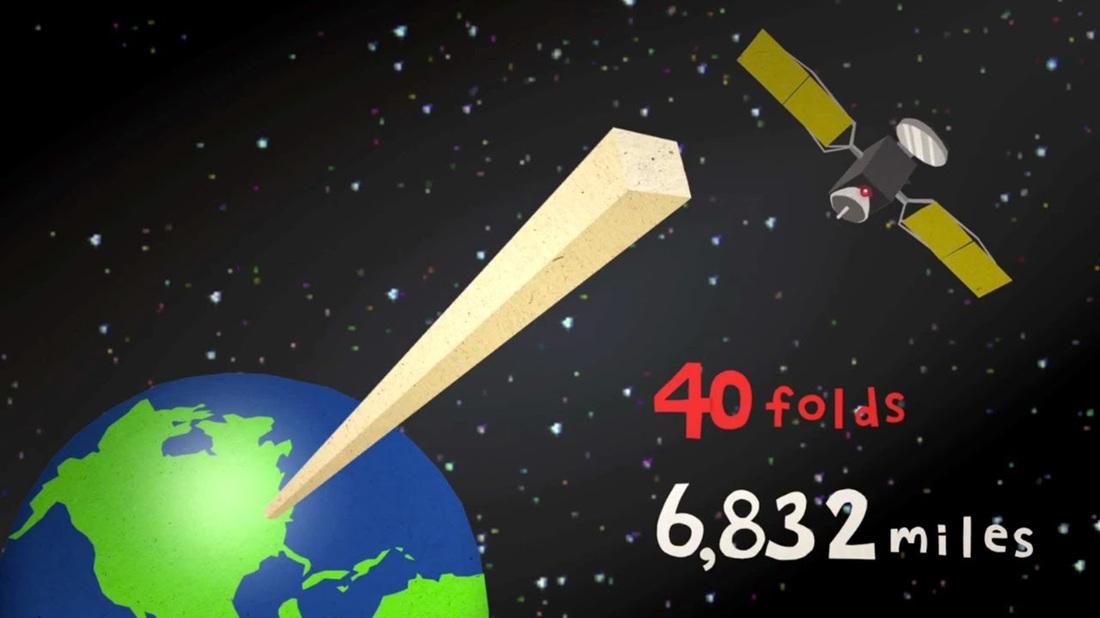
Folding to the Moon
It would take 42 folds in half in order to reach the moon with our paper we used. It is unrealistic because you cannot fold the paper 42 times in a row. The stack would be almost microscopic or extremely small after folding the paper this many times. The matters because you wouldn't be able to see the paper and therefore couldn't see if it reached it.
It would take 42 folds in half in order to reach the moon with our paper we used. It is unrealistic because you cannot fold the paper 42 times in a row. The stack would be almost microscopic or extremely small after folding the paper this many times. The matters because you wouldn't be able to see the paper and therefore couldn't see if it reached it.

College Loan
I spent a bit of time researching college loans and wanted to find the difference between a subsidized and an unsubsidized loan. I found out that a subsidize loan is a loan where the government will pay your interest on your loan until you graduate. A non subsidized loan is where you pay your own interest and your interest is added on right after the loan is made. Government loans have a interest of 4.66%. I also learned about fixed and variable rates. Variable loans functuate based market conditions and fixed rates will stay the same. Fixed rates right now are 6.39%. In class as a group, we figured out how much money we would be paying if we took out a 20,000 loan. We figured over 15 years we'd be paying $220 every month, then the loan would be payed off. We figured this out by using the equation A=P(1+R)^t
A= $20,000 (1+.0046)^15.
